See what Excel can't see -> Complex Relationships
Reduction of data silos
Using knowledge graphs to comprehensively map dependencies in supply chains and environmental risks and to take a holistic approach to avoiding data silos for an overall picture of supply chain risks.
Proactive dialogue with companies
For my work, I am super happy that deuter has agreed to work with me to get a realistic insight into the real world of supply chains, due diligence and challenges. Also working with WWF on georisks in supply chains.
Battling the jungle of supply chain data
What supply chain data currently exists, especially at the spatial scale? Inclusion of external and internal company data for comprehensive risk management at all levels of the supply chain. How can geopolitical, climatic and social risks be incorporated?
Risk management of the project
Coordinating communication with all partners, working out the challenges and requirements of the project. Implementing the technical solution, developing data models and practical applications for the project partners. Understanding the current supply chain laws and of course writing the research paper.
Abstract
The complex global supply chains are increasingly facing challenges from geopolitical instability, protectionism, climate change, and evolving regulatory requirements such as the German Supply Chain Due Diligence Act (LkSG) and the European Corporate Sustainability Due Diligence Directive (CSDDD). This study introduces Spatial Knowledge Graphs (SKGs) as a novel approach to tackle these challenges by integrating supply chain, environmental, and risk data for improved analysis and visualization in order to facilitate informed decision-making.
The study is based on a case study of a large German backpack manufacturer. The company's supply chain data is linked to environmental and geopolitical risk indicators to enable a detailed analysis of critical supply chain dynamics. Entities such as factories, materials and suppliers are modelled in a graph-based structure that captures their relationships across multiple supply chain levels. This structured approach enables a comprehensive analysis of dependencies, vulnerabilities and risks within the supply network. Key methods of analysis include centrality and cluster metrics, which enable the identification of critical nodes and clusters, and dynamic risk monitoring to assess the impact of external disruptions, such as extreme weather events, on the resilience of the supply chain. By integrating data on environmental and social aspects, the framework further supports the tracking of compliance with international sustainability regulations.
Results highlight the ability of SKGs to improve transparency and traceability while supporting agile risk management strategies. Visualizations and analytics reveal critical nodes and material dependencies across all supply chain stages, thereby offering the basis for analysing the state of resilience and to derive a risk mitigation strategies. Combined with regional data on the environmental and social performance, these insights empower companies to adapt their sourcing strategies and enhance supply chain sustainability.
By providing a holistic view of supply chain dynamics and fostering proactive risk mitigation, this work demonstrates the transformative potential of Spatial Knowledge Graphs in building resilient and sustainable supply chains, equipping companies with tools to navigate increasingly uncertain global markets.
Why am I doing this?
As a self-proclaimed data nerd, I thrive on creatively and logically engaging with data and its structures. Currently, there is a pressing need for solutions that enhance supply chain transparency, a topic that has gained significant attention and urgency. Graphs, particularly Spatial Knowledge Graphs, are emerging as a key trend in data science due to their ability to reveal complex relationships beyond just coordinates.
I am keen to explore the practical applications and potential of these graphs, especially in the realm of geospatial data, where relationships between geo phenomena offer valuable insights. Furthermore, my interest is aroused by the historical context of global trade in Augsburg using the example of the Fugger and Welser families and also the question of how we can trade more responsibly on a global scale today. By leveraging advanced geoinformatics, I aim to contribute to the ongoing conversation about supply chain sustainability and resilience.
But trying to keep it short:
Growing Importance of Supply Chain Transparency: With increasing global emphasis on sustainable practices, transparency in supply chains has become essential. Understanding and mitigating environmental and social risks in supply networks are critical for companies aiming to adhere to international sustainability standards and meet public expectations.
Unique Value of Geoinformatics in Risk Analysis: The integration of geospatial data in risk analysis has been limited within large commercial applications, despite a growing demand for spatially enriched data, particularly around climate and natural disaster risks. This geoinformatics approach, using spatial knowledge graphs, addresses this gap, allowing for precise, data-driven assessments that combine supply chain information with geographic vulnerability, providing a proactive tool for risk management.
Rise of Knowledge Graphs and Graph Databases in Recent Years: Knowledge graphs and graph databases have seen significant growth, transforming data management by mapping complex, interconnected relationships. This technology’s recent advancements make it particularly well-suited for capturing and analyzing the intricate dependencies of supply chains, offering new opportunities for improved transparency and resilience.
Research Objective
The research objective of this project is to use spatially enriched Knowledge Graphs to disclose the complex semantic relationships of global supply chains.
This enhances interpretation of risks, sustainability and regulatory requirements and thereby improves decision-making.
Research Questions
How can semantic relationships of complex Supply Chains be elaborated by Spatial Knowledge Graphs?
Which critical nodes can be identified using Spatial Knowledge Graphs?
Which practical questions from companies can be answered by the Knowledge Graph on regulatory compliance, sustainability procurement or risk mitigation?
What is a Knowledge Graph?
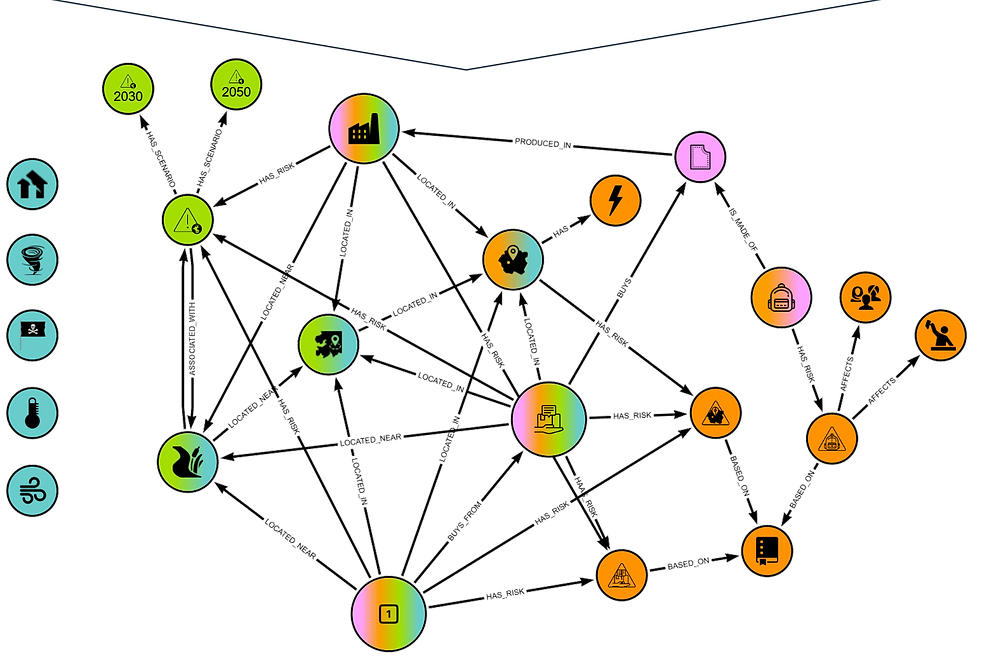
A Knowledge Graph is a structure that contains nodes, that are connected by edges.

Very similar to our human way of thinking and expressing. A quick example could be, a factory produces a product (or multiple) and is exposed to a risk or risks. So not only are we representing here what is there, but also how it is connected.
This might sound a bit controversial, especially for German companies, but Excel is not our 42, it is not our solution to anything and everything.
A Knowledge Graph is more than just a visualization, it is connection structure with meaning. This Knowledge is machine readable and queryable, because it is stored in a graph database.
In this case we are using Property Graphs, so we can add Attributes or multiple Attributes to not only the nodes, but also the Relationships.
A knowledge graph makes sense as a data structure when the relationships in the data are just as important as the data itself.

Data
The Knowledge Graph is fed with a wide variety of data from different sources in order to provide as comprehensive a picture of the situation as possible. Since the data comes from a variety of sources, is collected in very different ways, and also reflects a range of temporal and geographical resolutions, it is additionally evaluated for reliability at various levels. The aim is to achieve a kind of double transparency: on the one hand, transparency regarding the existing supply chain network and its interactions and risks, and on the other hand, transparency regarding the reliability of the underlying data and the associated risk analysis.
Supply Chain Information
The supply chain forms the basic backbone of the modeling. Material flows and trade relationships across different tiers are considered and linked on the basis of the available company data.

Data Model of the Knowledge Graph
The goal is to create a kind of toolkit that can be used to build a data model for the graph based on the available data. In this case, the data was divided into four different categories. For each category, we considered which questions we wanted to answer based on this data, identified the relationships within the data, and built a corresponding subgraph data model. Anchor nodes between the small data models are the Tier 1, 2, and 3, which can then be used to connect all further information later on. Each of the individual small models could also be solved relationally. But the magic of the graph begins when you combine everything into one large model and add one very important thing: context.

How to implement and analyze the Knowledge Graph?
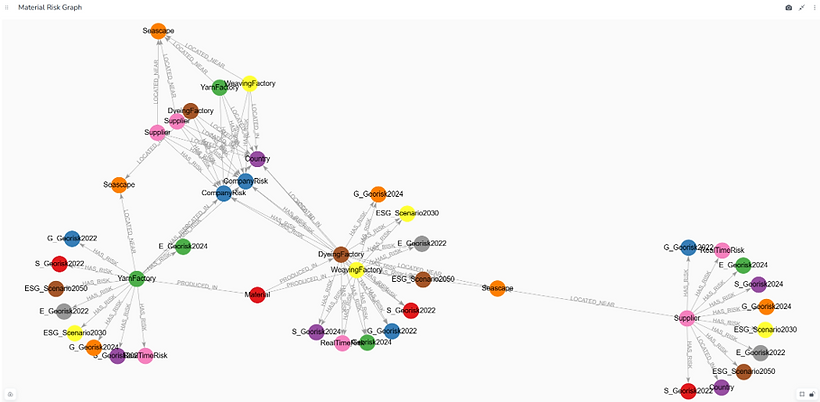
The data was implemented in Neo4j using the defined data model. In order to manage the graph, an analysis framework was devised to examine the graph step by step. To this end, queries are first used to examine the risks and dependencies in the network, particularly with regard to dependencies that were not previously known.
The graph can be used to answer the small questions defined for the data model, but also more extensive, complex questions that are now possible with the large network. In addition, the question “What can I actually ask the knowledge graph?” is examined. The resulting network is therefore also used to examine which questions can actually be answered now, because what I actually want to know and what is possible is often a core problem.
The vulnerability of the network is analyzed using graph metrics such as centrality. Centrality, for example, indicates how many relationships a node has with others in the network, so it's a bit like searching for VIP nodes, i.e., who knows a lot of other people, which would be bad if such an actor were to fail. But clusters can also be examined; here, clusters in the network structure, spatial and thematic clusters can be broken down.
Investigation of risks and their affects on the supply chain network
Investigation of the network resilience based on centrality and clusters in the graph
Output of the graphs knowledge for reporting
How to visualize the Results?
At the beginning of the project, there were discussions about whether it would be possible to calculate a final risk index for each material at the end. I was very reluctant to do this because it would be like using the knowledge graph to prepare a beautiful and elaborate wedding buffet only to blend it into astronaut food at the end. In the end, five main risk categories were agreed upon: energy risk, real-time risks, and environmental, social, and governance risks. Each of these risks can be divided into sub-risks for which it is possible to trace which node(s) the information originates from and which attributes of the node were decisive for this. Because the graph is so flexible, this risk analysis can be easily adapted either at the product level, where all information for a product is aggregated, or for individual materials, locations, countries of production, or other units. Because the reliability of the data was also determined beforehand, it is possible to analyze not only how the risk propagates through the network, but also the reliability and significance of this information.

In addition, the graph can be examined and queried using a dashboard. Here, information can be filtered and exported. Individual material supply chains can be visualized and analyzed according to various criteria.
Conclusion
First of all: See the things, that Excel can't see and that is complex relationships
Reduction of data and knowledge silos: Data silos are a huge problem, often times we do not know what data is actually available already and what to do with it. The other problem is knowledge silos -> Teams not really working together in a company. The Knowledge Graph is a great tool to connect the work of different teams in one model and also allows for consideration from the perspective of various experts.
Answering questions and creating new ones: Often, we don't really know exactly what we want to know, and what can you even ask a graph? In addition, most users are humans, and not everyone is capable of formulating what they want in a way that a machine can understand. A graph is structured very similarly to our human way of expressing ourselves, which can be combined excellently with natural language solutions.
Holistic view of the supply chain: We want the whole pizza, not just one slice. Of course, this project is only one slice, but we want a bigger one with more toppings to better understand the world around us.
Transparency as the basis for resilience: In order to become resilient, we first need to understand what phase actually is. Transparency is the first important step in this process. Not only in terms of subject matter, but also in terms of where our information actually comes from and on what basis we make decisions here.
Talks and Speeches

Showcase: Nachhaltiges Lieferkettenmanagement | Esri Konferenz Schweiz 2024

10 - SAE - Leonie Engemann.mp4
